Hello Traders,
In this market analysis educational article we will explain and highlight the relationship and idea of using the XAUXAG ratio in tracking Gold’s major trends and cycles. The XAUXAG Ratio is a measure of the relative value of gold to silver. It is calculated by dividing the price of one troy ounce of gold (XAU) by the price of one troy ounce of silver (XAG). The ratio can be used to assess whether gold or silver is over- or under-valued relative to the other.
In the over market dynamics it is known that an uptrend in the ratio can represent weakness across those metals while any sideways or lower trend can overall represent strength. We can clearly see that once looking at the charts, it should be apparent that the last 2 years the ratio has been clearly sideways and allowed Gold to trend in a magnificent uptrend since Q4 2022.
XAUXAG Ratio Daily Chart – Highlighting The Range Trading 96 – 73 Area
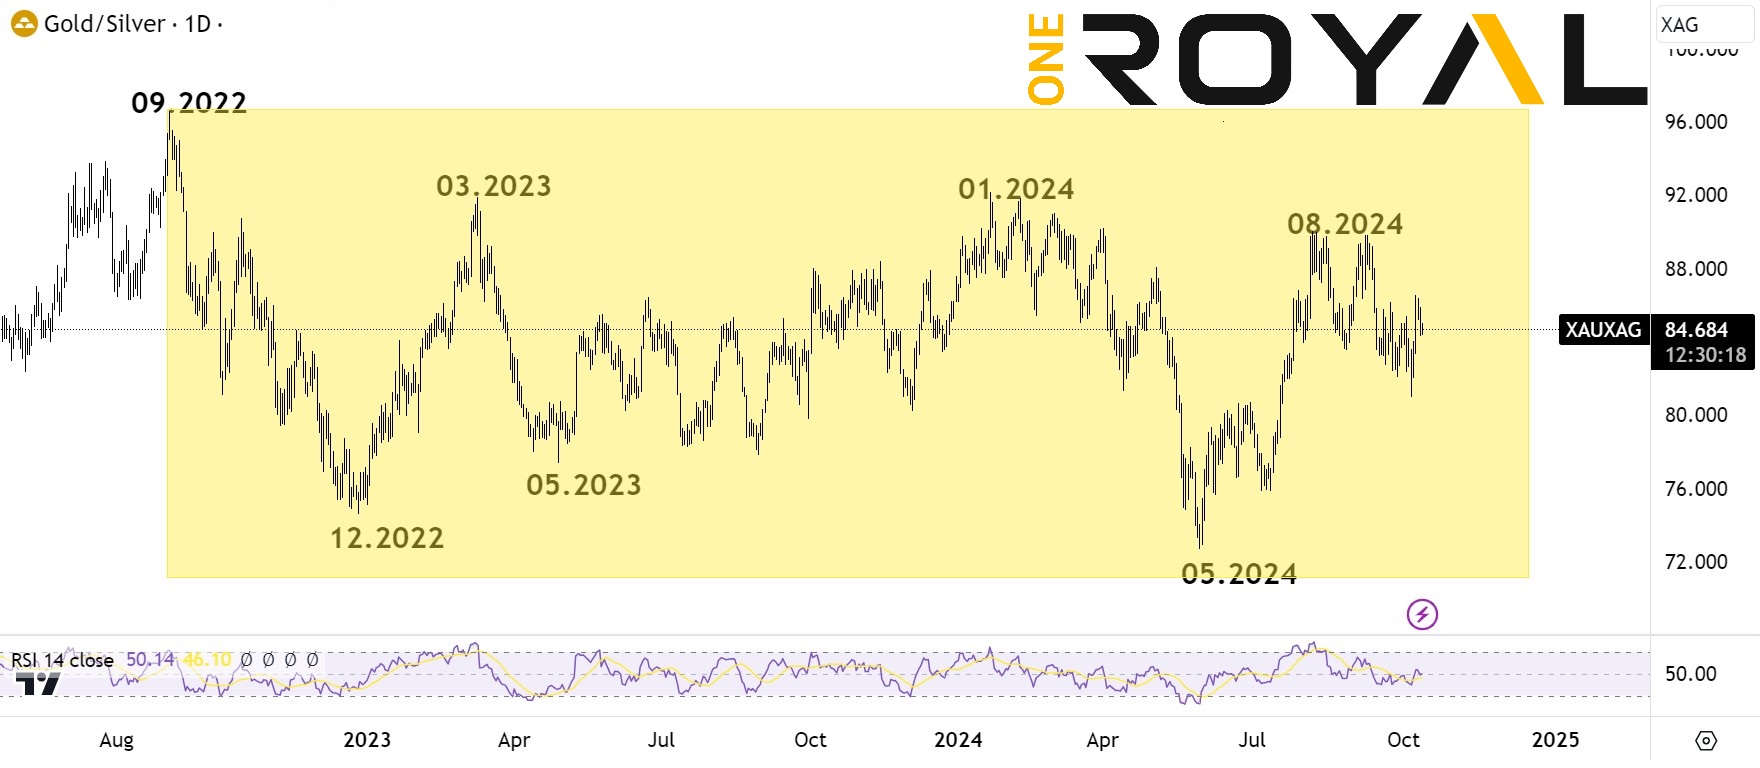
As we can observe the ratio’s overall 2 year trend is sideways to lower which allows Gold to have an uptrend. As the idea comes that in case which Silver is significantly weak then the ratio trends higher but the overall metals trend is lower. What we have had during the last 2 years was the opposite.
This dynamic is better illustrated by combining the daily chart of gold and comparing it to the ratio.
XAUXAG Ratio VS Gold (XAUUSD) Daily Time Frame
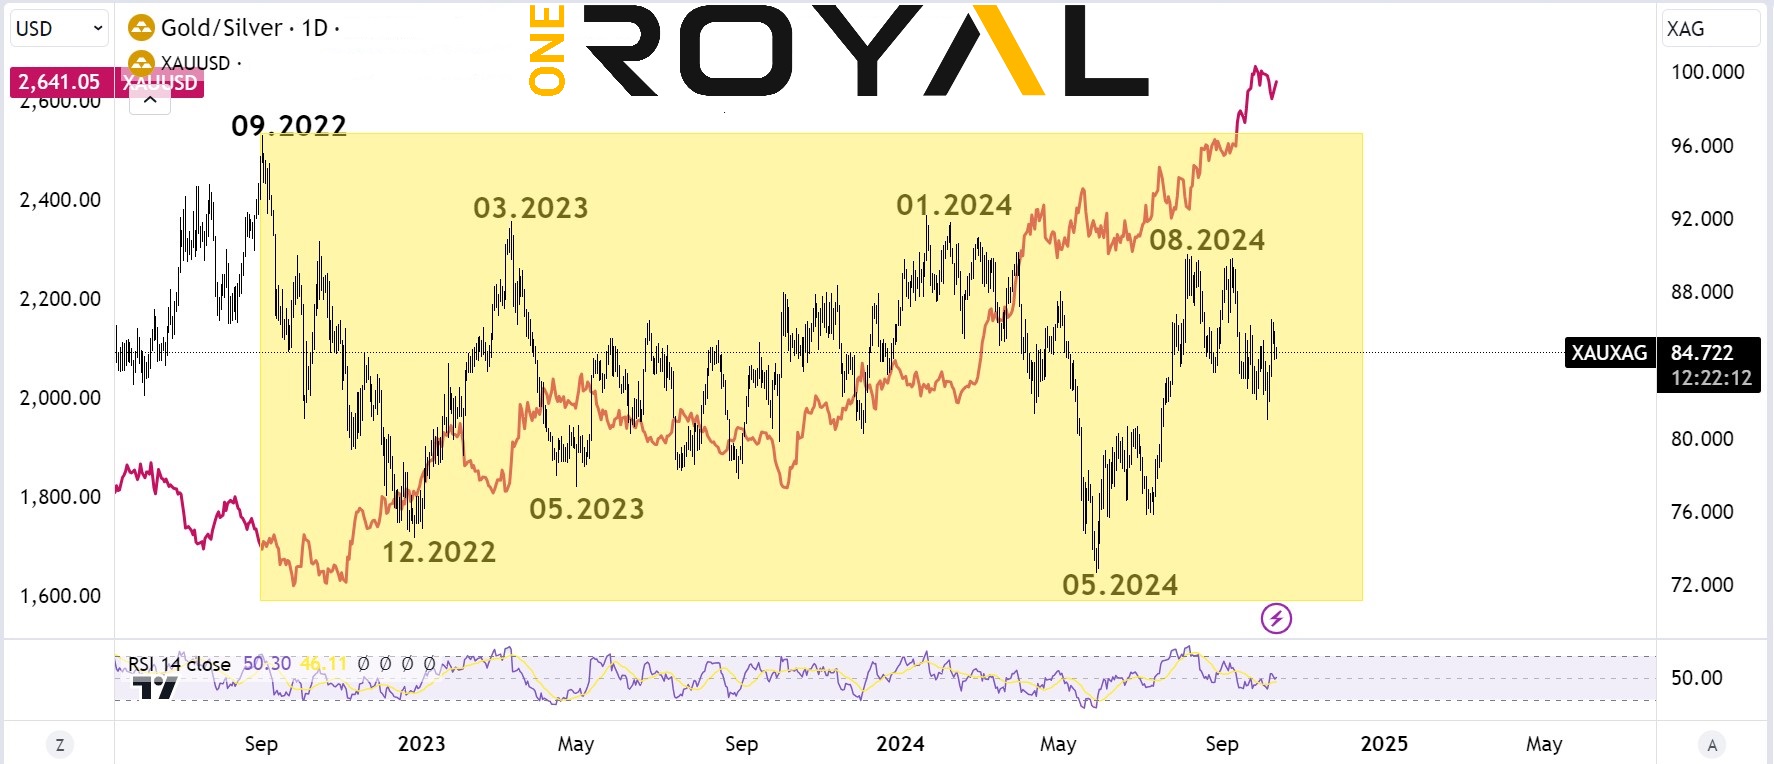
Now it is apparent how Gold has formed a major low slightly after the XAUXAG ratio peaked around the 96 area in September 2022. Since then Gold has been in a significant uptrend as the ratio remains sideways to lower. Gold corrective periods can be seen while the ratio was within a corrective uptrend, while significant breakouts in Gold took place while the ratio starts to sell off.
Analyzing and keeping an eye on the ratio may provide with more clarity for gold and metal traders around the world in order to identify strength or weakness and potentially make better trading decisions.
If you are new here and you do not already have a trading account you can sign up at: https://www.oneroyal.com/en/
Risk Disclaimer: The information provided on this page, including market analysis, forecasts, and opinions, is for informational purposes only and does not constitute investment advice or a recommendation to buy or sell any financial instruments. Investing in financial instruments involves significant risk, including the potential loss of the principal amount invested. Leveraged products, such as CFDs and forex, carry a high level of risk and may not be suitable for all investors. Past performance is not indicative of future results. You should conduct your own research and consult with a qualified financial advisor before making any investment decisions. The firm does not guarantee the accuracy or completeness of the information provided and shall not be liable for any losses or damages arising from reliance on this content. By using this page, you acknowledge and accept these risks.