Hello Traders,
In this article we will analyze and look at WTI Crude Oil and it’s cycle from March 2022 to the downside and explain both it’s technical outlook as well as various fundamentals and correlate the move with the US Dollar Index itself. We are utilizing the official price data from NYMEX Exchange for the illustrations. As we all remember during March – April of 2020 Oil has reached extreme levels at the 0 line and an overreaction below even. Since then it has managed to fully recover up to the 130$ mark which has been reached in March of 2022. Since then it has been trading lower overall and many things have been on the table both fundamentally as well as technically.
Let’s first observe and have a look at the technical analysis on Oil in the weekly timeframe:
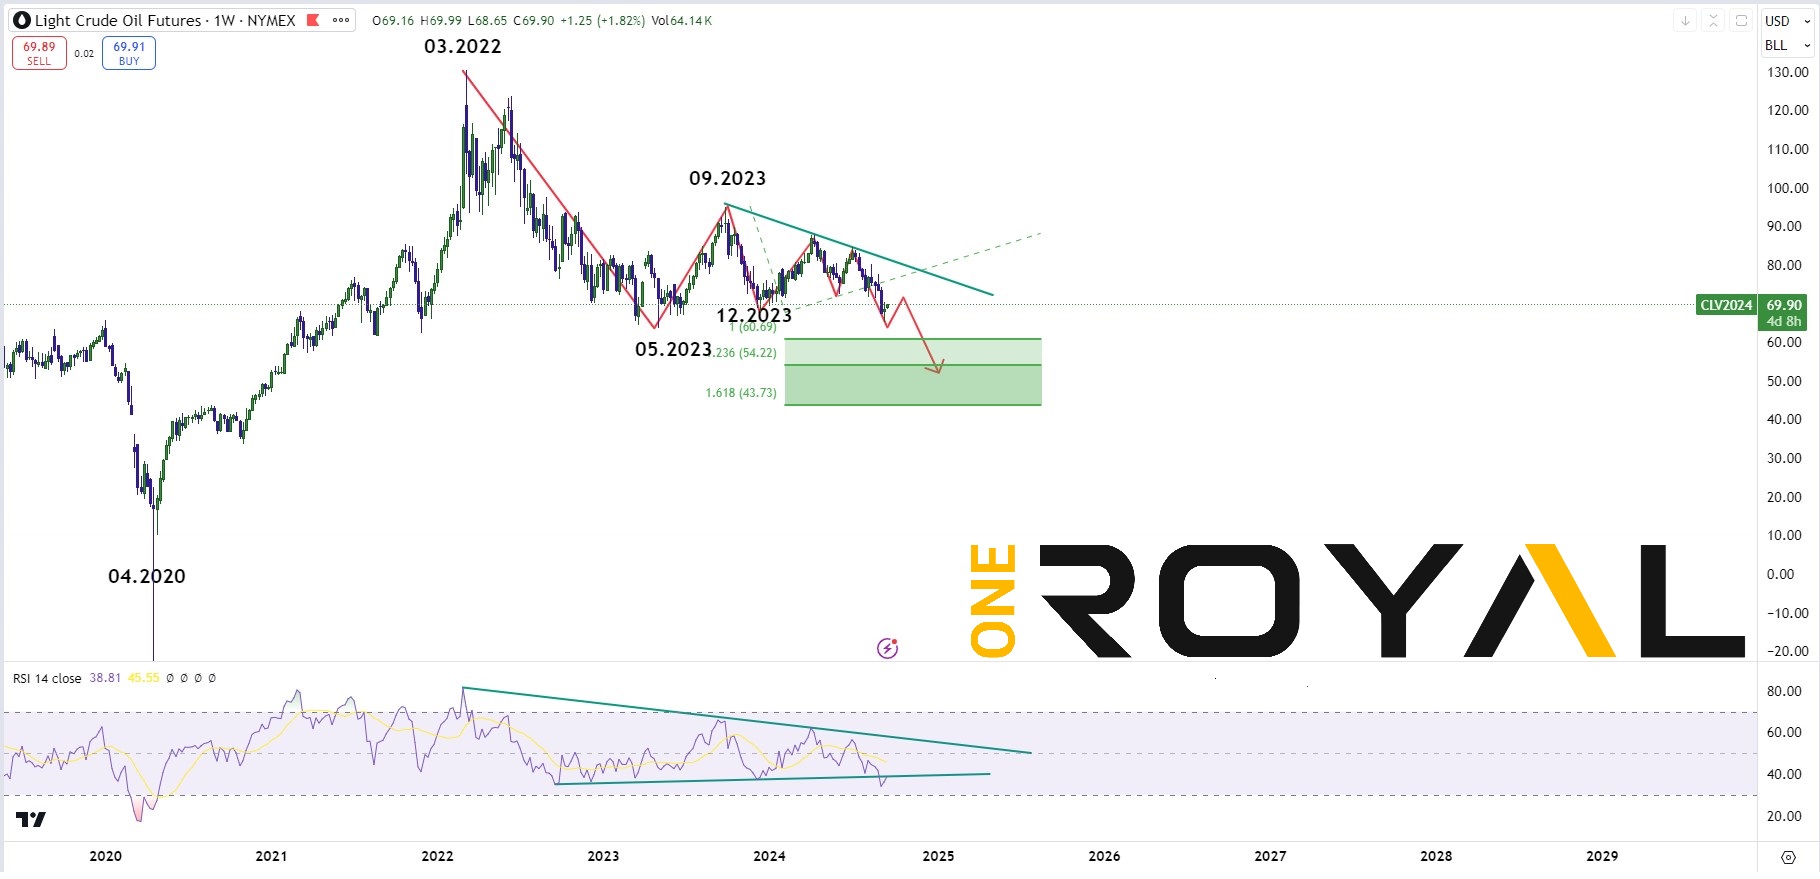
As we can see since the peak of 2022 it has created a short term pivot in May 2023 at $63.66 and a bounce pivot in September 2023. Since then it has been lower and recently it has broken below the lows from December 2023. We can see that the Weekly RSI Indicator has broken below the RSI trendline channel and shows weakness. Additionally from the first decline from September to December and the bounce that followed the market has generated a Fibonacci extension area lower which might act as potential bearish target area to the downside as well as a counter reaction area if reached. The area is from $60.69 – $43.73 which can take us below the lows from May 2023. In the near term we might see some some recovery bounces but as far as they remain below the indicative price trendline we can expect to see the fib extension area below. If the trendline break higher then Oil could be staying sideways since 2023 into 2025 and retest the $80-$90 area.
Let’s go through certain fundamental reasonings as to why perhaps, the decline has been taking place over the past 2 years and ongoing as well as to overlay and compare the chart with the USDX itself. One of the main highlights that we start seeing are the talks from the BRICS nations in regards to trading Oil between them without using the US Dollar. (More on BRICS at: https://en.wikipedia.org/wiki/BRICS ) We will have more information during their summit next month in October between the 22nd – 24th, taking place in the Kazan region of Russia. The market appeared to have reacted in a way from the above situation and talks as the price of Oil was mainly supported through the dollar trade environment. Now that this environment started getting into doubt and risk we can see that displayed in the overall trend of Oil thus far.
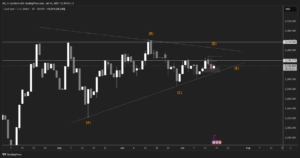
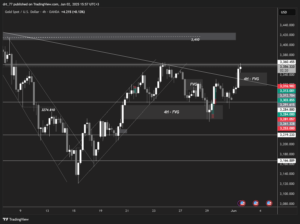
WTI Oil VS USDX (DXY)
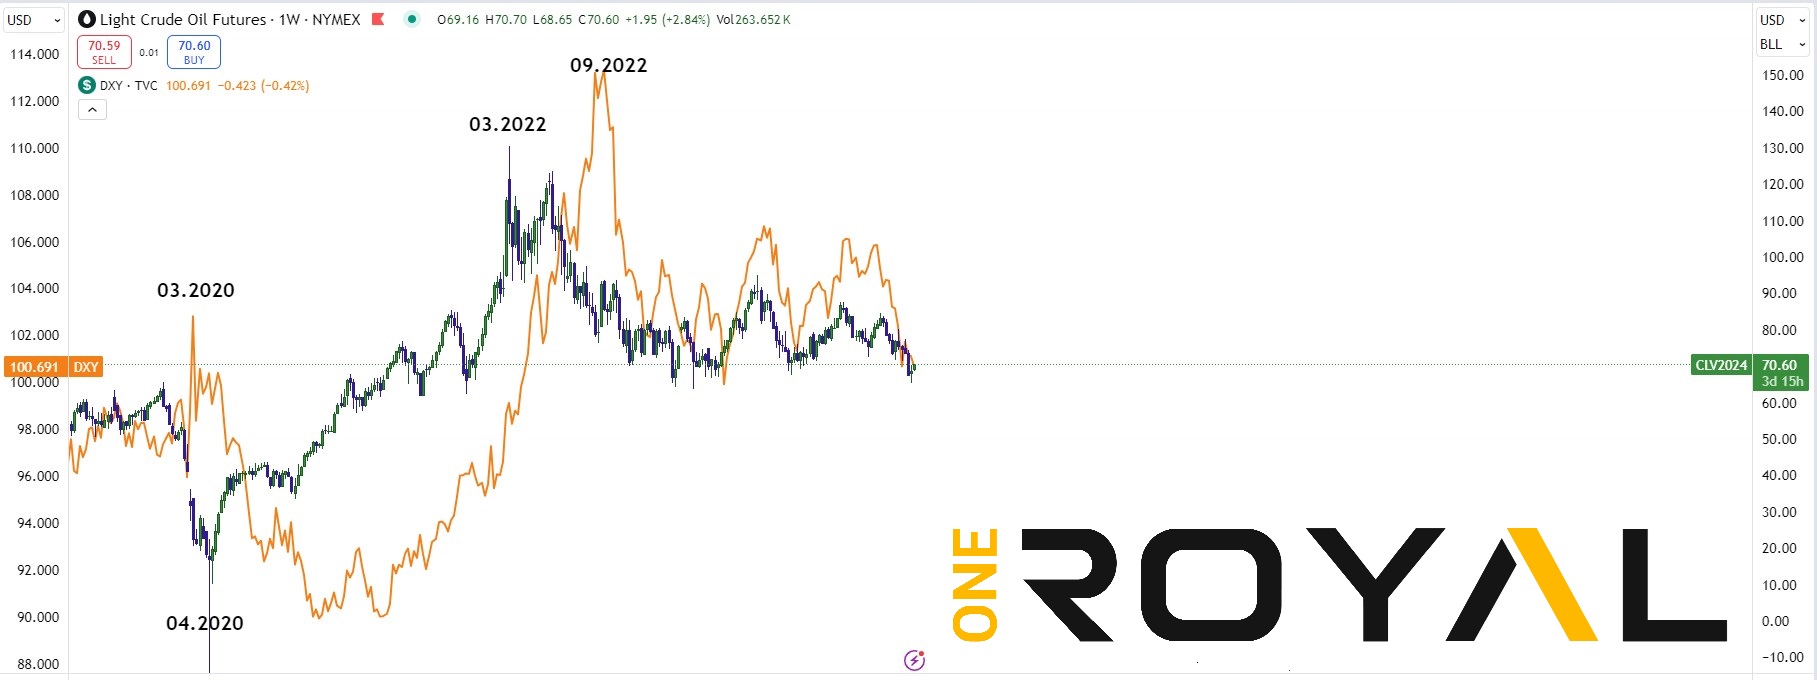
We can overall see how there are commonalities in terms of their overall weekly timeframe trend from their respective 2022 peaks. In March 2022 we had the 130$ peak in Oil and a few months later in September 2022 the one if the US Dollar Index around the 114.800 area. Since their peaks both seems to have been aligned in a unique way together to what it now looks like a twin’s relationship. Is this the end of the known petrodollar? Are we heading towards a de dollarization process with BRICS becoming more relevant in the world economy and the US to start losing part of it’s dominance in the world reserve and trading currency?
Heading Into 2025, should be an interesting period to observe how geopolitical relationships will evolve and next month with BRICS Summit we will be looking for more potential news in relation to what we might expect to see in the near future. Traders need to pay attention to such news and changes as markets are a dynamic reflection of the macro trading environment.
If you are new here and you do not already have a trading account you can sign up at: https://www.oneroyal.com/en/
Risk Disclaimer: The information provided on this page, including market analysis, forecasts, and opinions, is for informational purposes only and does not constitute investment advice or a recommendation to buy or sell any financial instruments. Investing in financial instruments involves significant risk, including the potential loss of the principal amount invested. Leveraged products, such as CFDs and forex, carry a high level of risk and may not be suitable for all investors. Past performance is not indicative of future results. You should conduct your own research and consult with a qualified financial advisor before making any investment decisions. The firm does not guarantee the accuracy or completeness of the information provided and shall not be liable for any losses or damages arising from reliance on this content. By using this page, you acknowledge and accept these risks.