Hello Traders,
In this article we are going to analyze the cycle over the last 4 years in Silver as well as compare it against Gold. We are going to focus from March 2020 into to date and see what a possible bullish breakout could provide in Silver which has overall been lagging the price growth of Gold. Key takeaways here are to consider what it means when those metal are breaking higher to the counterparty of this market which as we all know the measurement of their prices is in USD $.
Having these assets breaking out higher, overall it means that the denominator in this case which is the USD $ depreciates in value while these metals rise in value. We can also look at our cost of living over the past 4 years and realize that overall it has gone up which directly links and connects to these moves we are seeing as well to those metals.
Historically these precious metals have been used for trade between good and services before they were replaced with today’s fiat currencies. As well as they are utilized today when they are in demand by global investors as a potential hedge against fiat currency depreciation and hedge against inflation.
Below we are going to see the trend over the past 4 years and look at the relationship between Silver & Gold.
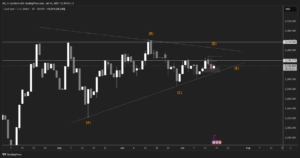
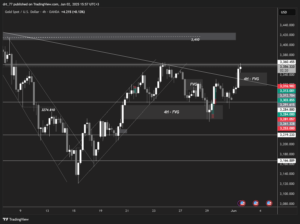
Silver – XAGUSD Weekly TF – Cycle from 2020 – RSI Channel Looking for a Breakout – If $32.453 breaks A Potential Run Towards $40+ Might Be In Play – Revisiting Highs From 2011

Silver VS Gold Weekly TF (XAGUSD VS XAUUSD) Gold Has Been Leading The Cycle – Can Silver Catch Up?

As we can see Gold has been the leader in terms of the cycle from 09.2022 and the question here is whether Silver is capable to catch up with Gold within what it looks to be a strong rally to the upside. While many analysts and banks are forecasting price targets for Gold towards the $2800 – $3000 area, then where could Silver reach in the event of further upside? If this rally continues and Silver breaks above the $32.453 area a bullish sequence may expose the $40 – $50 area which are the previous all time highs for Silver from 2011 peak.
XAGUSD VS DXY (USD Index) Can We see the Inverse Correlation?

Heading into Q4 of 2024 into Q1 2025 these metals might provide us with some interesting moves ahead, provided that Silver is capable to clear with conviction the previous recent high. For a move higher to take place it will mean that potentially the USDX remains under pressure and remain at least sideways to lower. Traders and investors should keep an eye of the levels in order to gain more clarity or conviction as to what might happen next.
If you are new here and you do not already have a trading account you can sign up at: https://www.oneroyal.com/en/
Risk Disclaimer: The information provided on this page, including market analysis, forecasts, and opinions, is for informational purposes only and does not constitute investment advice or a recommendation to buy or sell any financial instruments. Investing in financial instruments involves significant risk, including the potential loss of the principal amount invested. Leveraged products, such as CFDs and forex, carry a high level of risk and may not be suitable for all investors. Past performance is not indicative of future results. You should conduct your own research and consult with a qualified financial advisor before making any investment decisions. The firm does not guarantee the accuracy or completeness of the information provided and shall not be liable for any losses or damages arising from reliance on this content. By using this page, you acknowledge and accept these risks.


