Hello Traders,
In this article we will analyze the Russell 2000 Index and compare it with the ES500 Mini Futures (SP500 Futures market) from the cycle from 2020 as it is still trading below the previous peak from 2021 while ES has made new highs. The Russell 2000 Index is a stock market index that measures the performance of the 2,000 smaller companies included in the Russell 3000 Index. The Russell 2000 is managed by London’s FTSE Russell Group, widely regarded as a bellwether of the US economy because of its focus on smaller companies in the US market.
A couple of important details about the Index:
The Russell 2000 Index was launched in 1984 by the Frank Russell Company. It is a U. index managed by FTSE Russell, a subsidiary of the London Stock Exchange (LSE) Group. The index is composed of about 2,000 small-cap companies. The index is the most widely quoted measure of the overall performance of small-cap to mid-cap stocks. It represents approximately 7% of the total Russell 3000 market capitalization and is made up of the bottom two-thirds in terms of company size of the Russell 3000 index. The larger index reflects the movements of nearly 96% of all publicly traded US stocks.
| Russell 2000 by Industry | |
|---|---|
| Industry | % of Portfolio |
| Industrials | 19.00% |
| Healthcare | 15.15% |
| Financials | 14.84% |
| Technology | 13.92% |
| Consumer Discretionary | 13.09% |
| Energy | 7.81% |
| Real Estate | 5.79% |
| Basic Materials | 3.91% |
| Consumer Staples | 2.68% |
| Utilities | 2.64% |
| Telecommunications | 1.17% |
Russell 2000 E-mini Futures (Data Provided by CME)
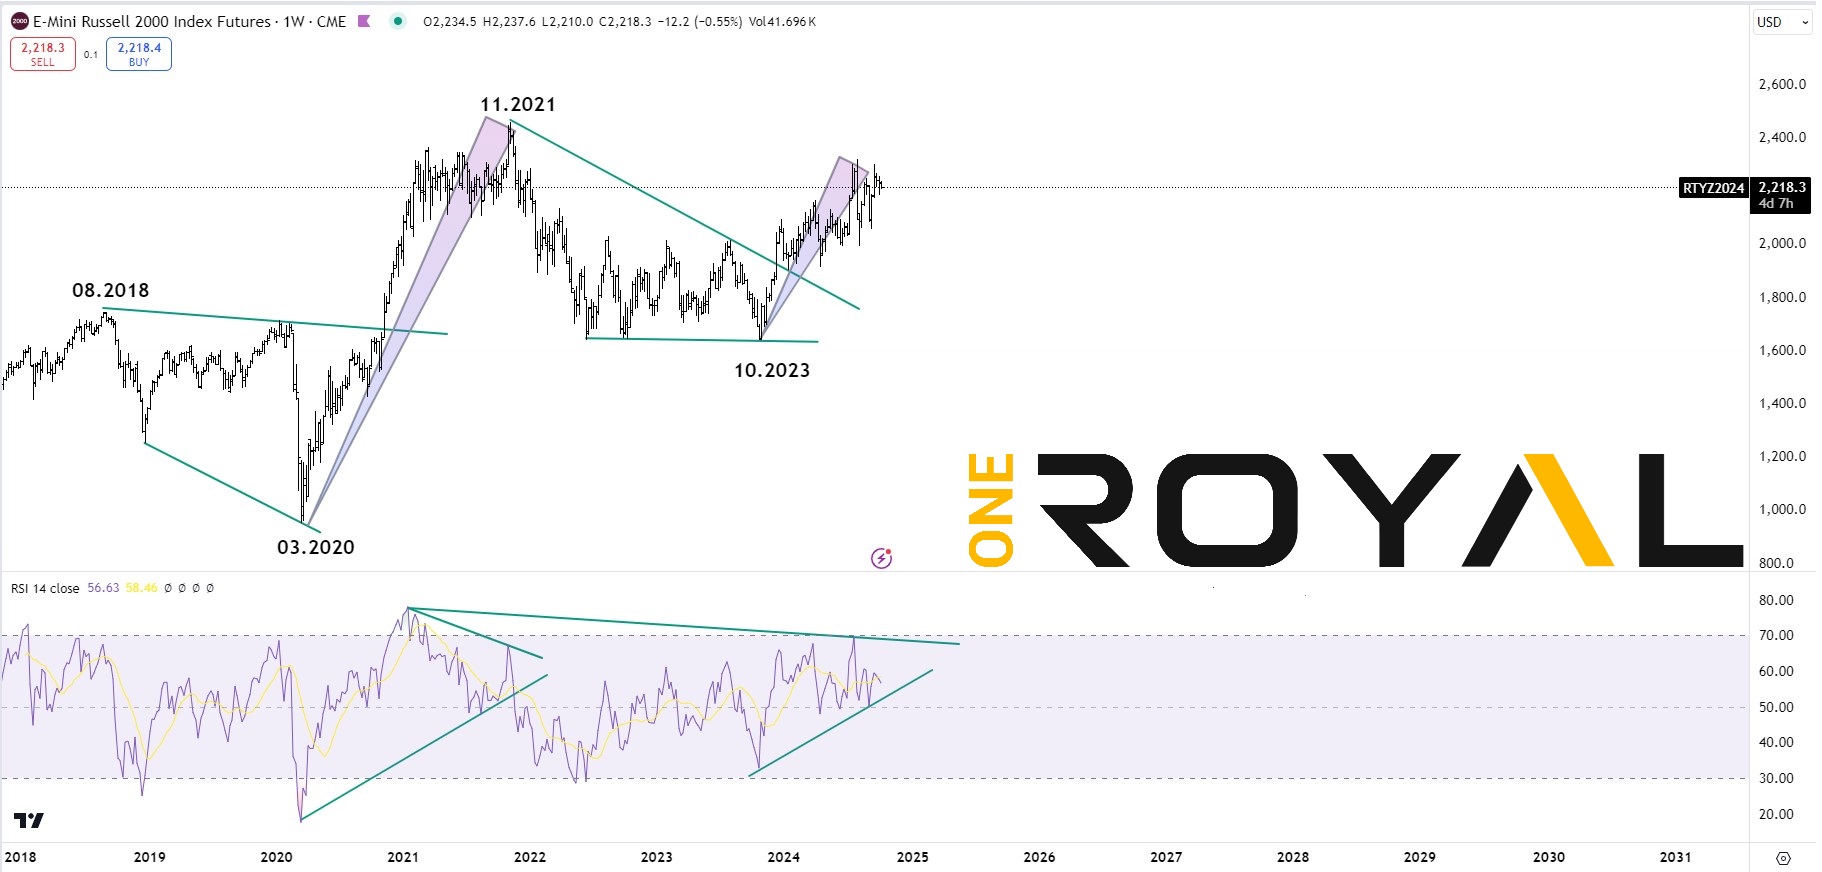
As we can see since March 2020 after making an all time high in November 2021 at the $2459 area the Index had a corrective phase into October’s 2023 low at the $1638 area. A breakout took place next, however currently it has been within a sideways consolidation with buyers not being able yet to gain momentum to the upside. Whereas, large cap Indices such as the SP500 or the Nasdaq and Dow Jones making new all time highs within this year, the Russell has not done that yet.
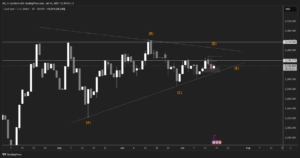
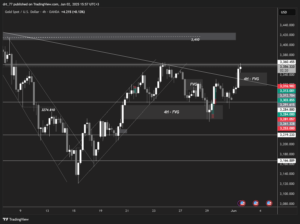
A comparison against the ES500 Mini Futures
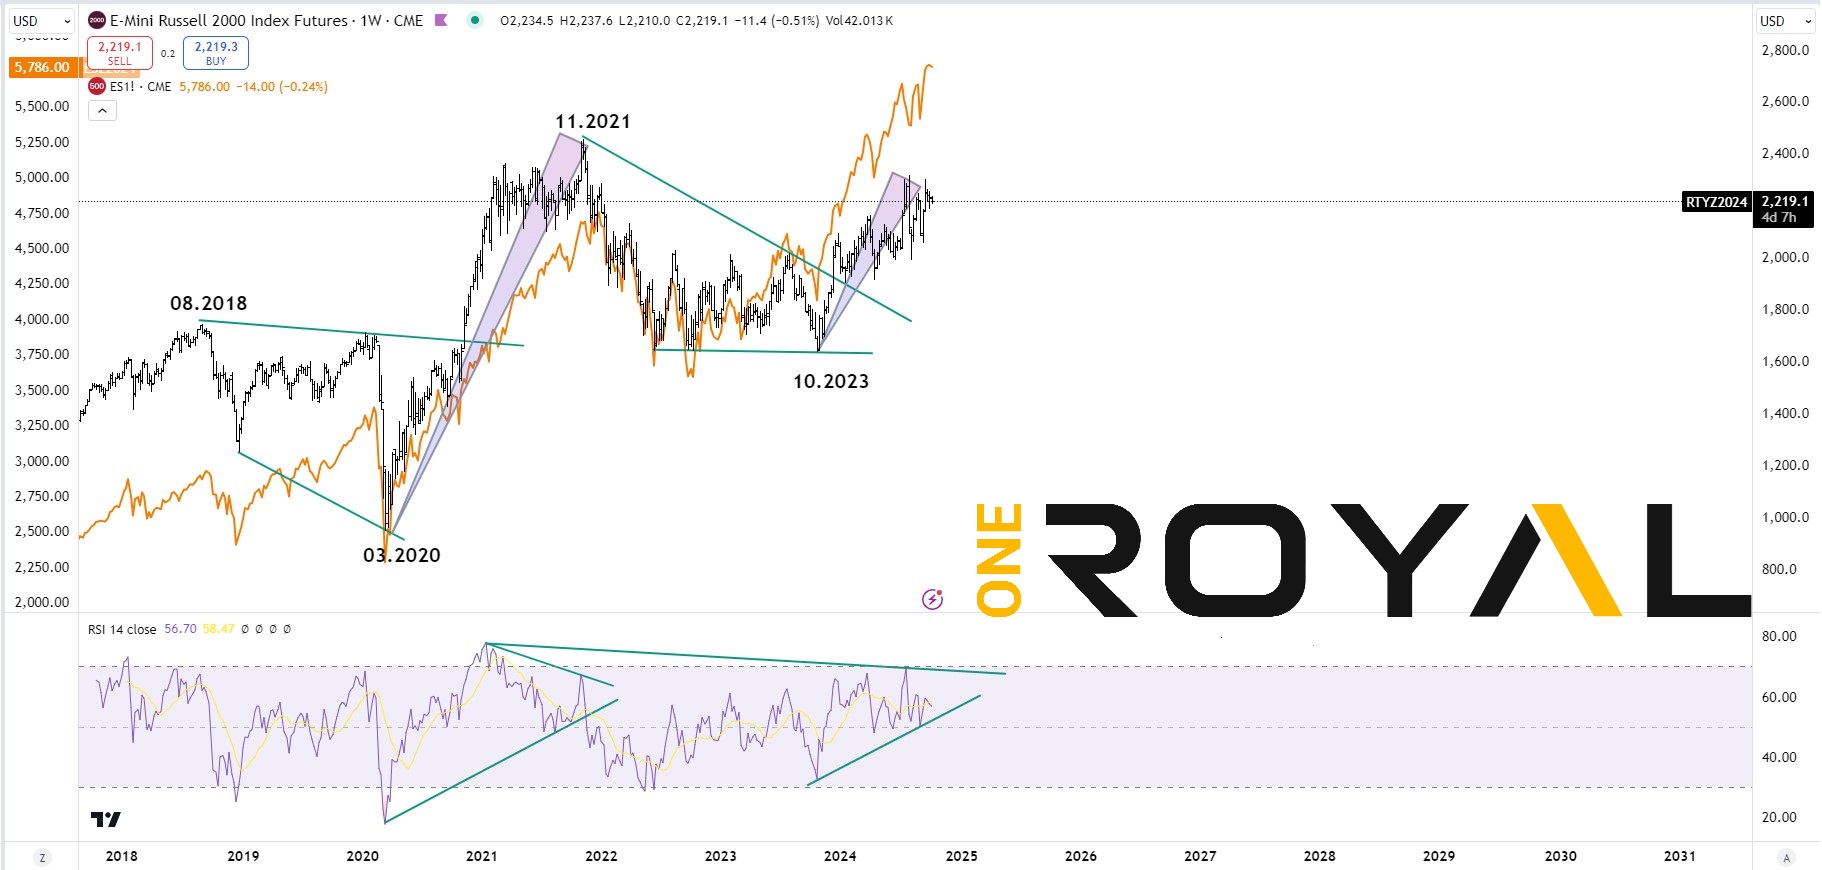
Buyers will need to catch up momentum soon and a breakout of the RSI weekly trendline vs 2020 peak if the Index should be capable of heading for new all time highs, and catch up with the pace of the ES500 in which has already been trading within all time highs territory within this year. The question will be whether investors find value in the small to mid cap market and whether economic outlook continues to be positive in the US Economy.
As of recent we have seen the US jobs market recovering from the last 2 months worries of a possible recession while the Federal Reserve last month started it’s easing of the monetary policy with rate cuts back on the table. Thus far from 5.50% down to 5% as inflation data continues to cool down as well. Investors should anticipate further data in determining whether the soft landing case should play out as per Fed’s chairman Jerome Powell and the jobs data ahead with further potential rate cuts.
Failure to gain momentum, could find the Russell 2000 entering into another consolidation or a worst scenario in doing a double correction from 2021’s peak. Heading into the end of 2024 and Q1 of 2025 the small to mid cap sector should show investor’s intend and sentiment ahead as more US Economic data is being released.
If you are new here and you do not already have a trading account you can sign up at: https://www.oneroyal.com/en/
Risk Disclaimer: The information provided on this page, including market analysis, forecasts, and opinions, is for informational purposes only and does not constitute investment advice or a recommendation to buy or sell any financial instruments. Investing in financial instruments involves significant risk, including the potential loss of the principal amount invested. Leveraged products, such as CFDs and forex, carry a high level of risk and may not be suitable for all investors. Past performance is not indicative of future results. You should conduct your own research and consult with a qualified financial advisor before making any investment decisions. The firm does not guarantee the accuracy or completeness of the information provided and shall not be liable for any losses or damages arising from reliance on this content. By using this page, you acknowledge and accept these risks.