Hello Traders,
In this educational article we will explain what the MACD Indicator is and how it could be used in market analysis and potentially help us with our trading decisions. Firstly, the initials stand for Moving Average Convergence/Divergence. The indicator is known within the industry as one of the indicators that could help in identifying potential market shifts of trends for either buying or selling the market.
A few key characteristics of the MACD:
- The MACD line is calculated by subtracting the 26-period exponential moving average (EMA) from the 12-period EMA.
- The signal line is a nine-period EMA of the MACD line.
- MACD is best used with the daily time frame, where the traditional settings of 26/12/9 days is the default.
Let’s dive into some charts to explain and indicate the features as well as some examples. We will see how we can potentially use it with combination of the RSI indicator as well. In our previous educational article, we have talked about the RSI indicator and how it helped with determine the 4hr trend in EURUSD and now we will see what the MACD was indicating for the market trend shift in the pair using the 4hr time frame just for the illustration purposes.
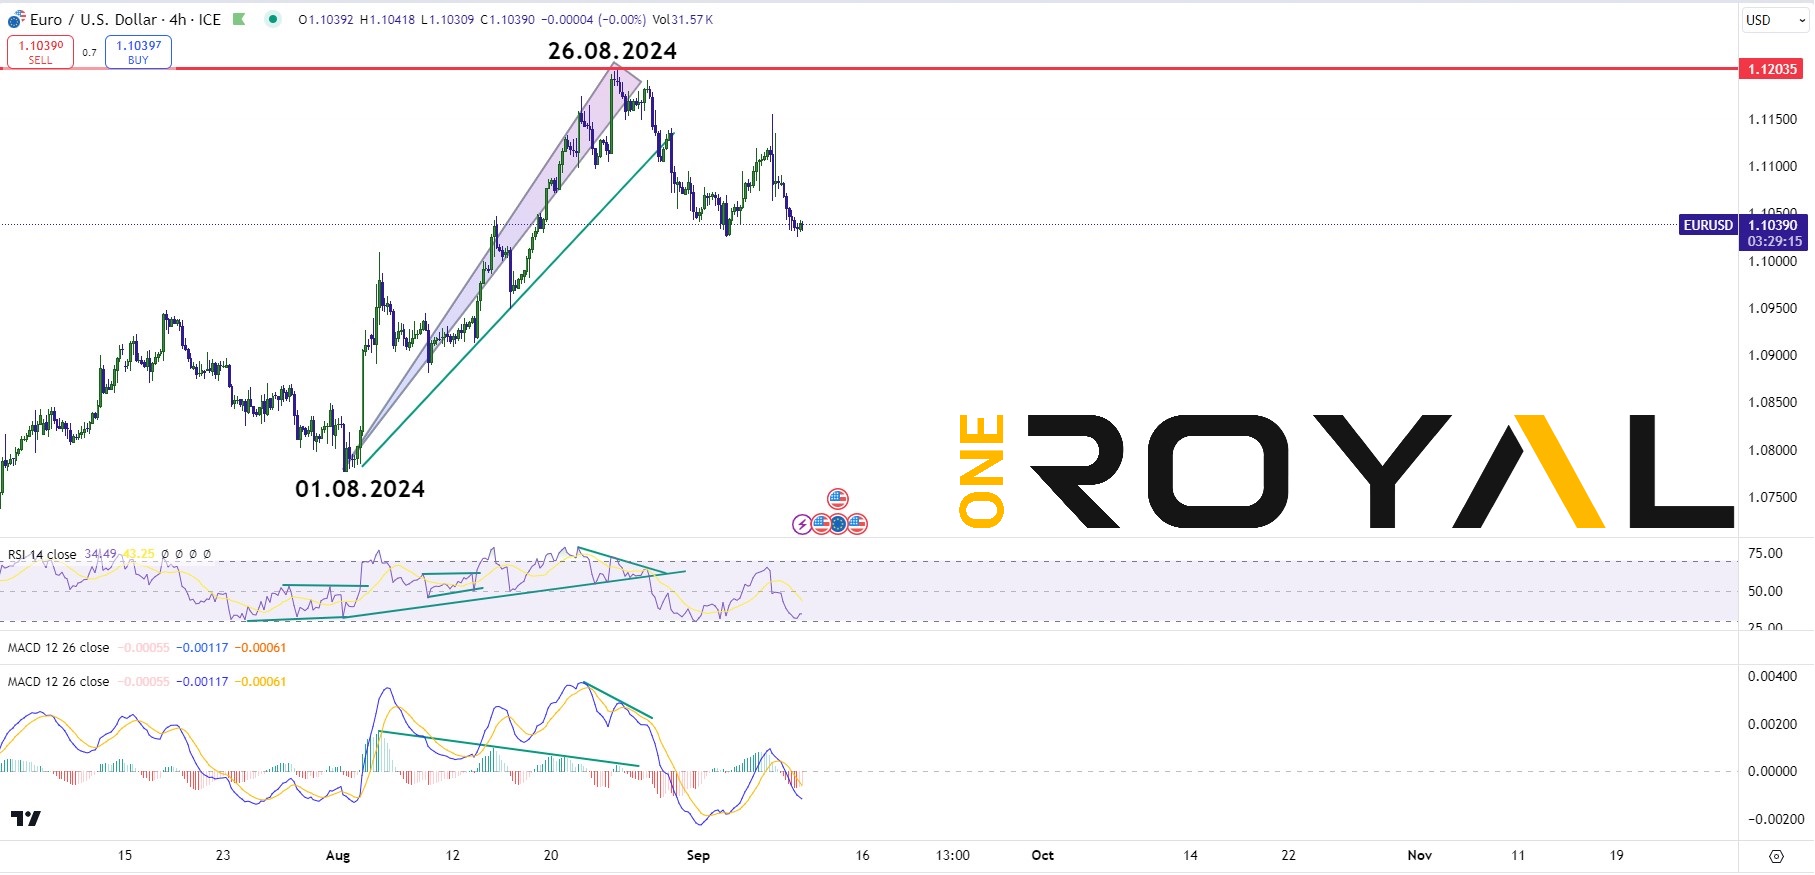
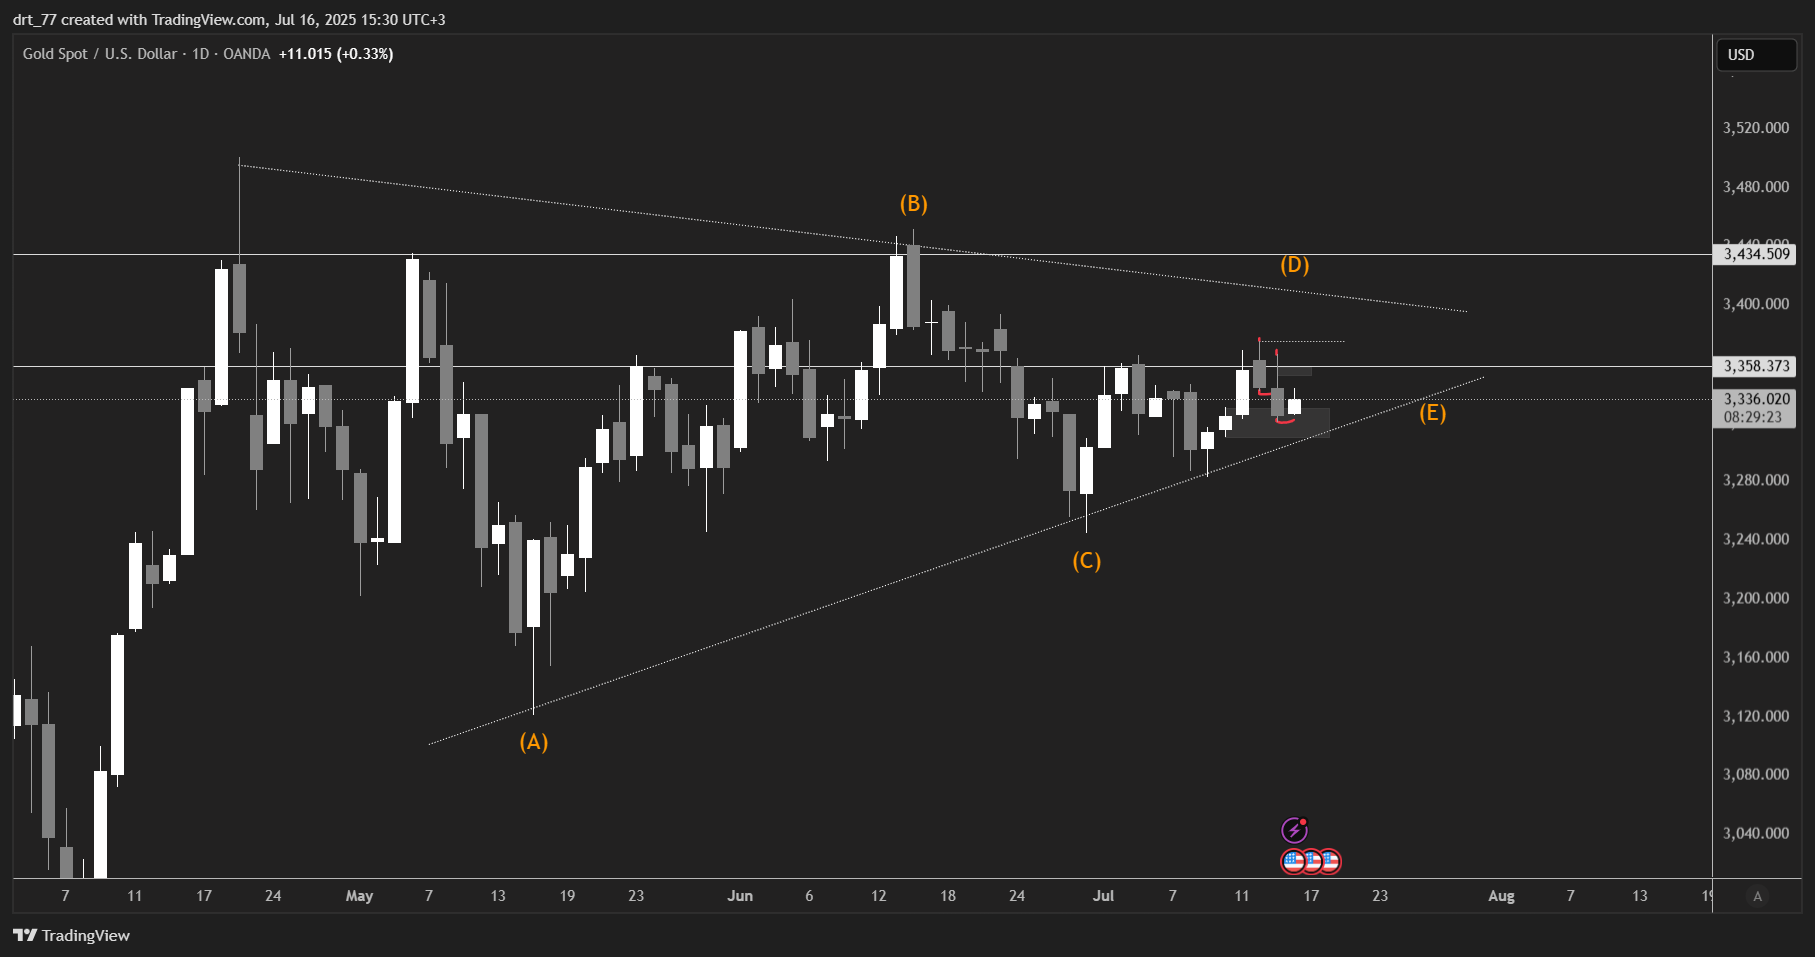
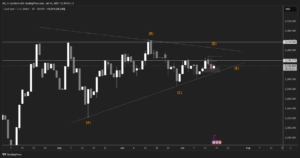
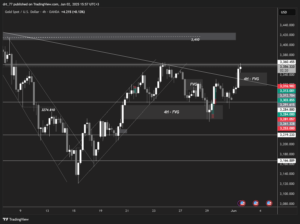
As we are illustrating on the MACD indicator the EURUSD was in an uptrend and while making higher highs the histogram bars (green bars in this case) where making lower lows which it indicates that the market starts to lose momentum. The moment that the RSI has generated a lower low with the price reaching a higher high and created a divergence, the same occurred in our MACD signal line (yellow line) followed by the MACD line crossover lower (blue line) and then the market has confirmed the end of that specific uptrend with the price breaking lower.
As we have mentioned above the MACD is best used with the daily timeframe to have on average more reliable data as the indicator can also get unreliable the lower the timeframes. 4 hour time frame can be utilized when the market has an established trend, it can help with determining the impulses and pullbacks, while any other time frame lower can have lot of variation and thus provide us with much less reliability as the market has higher chances of creating much more fake outs in lower timeframes.
Hopefully you have found the above educational article helpful and learned something valuable today to help you with your trading decisions ahead. If you are new here and you do not have a trading account with us yet, you can sign up one at: https://www.oneroyal.com/en/
Risk Disclaimer: The information provided on this page, including market analysis, forecasts, and opinions, is for informational purposes only and does not constitute investment advice or a recommendation to buy or sell any financial instruments. Investing in financial instruments involves significant risk, including the potential loss of the principal amount invested. Leveraged products, such as CFDs and forex, carry a high level of risk and may not be suitable for all investors. Past performance is not indicative of future results. You should conduct your own research and consult with a qualified financial advisor before making any investment decisions. The firm does not guarantee the accuracy or completeness of the information provided and shall not be liable for any losses or damages arising from reliance on this content. By using this page, you acknowledge and accept these risks.