Hello Traders,
As the US Indices are breaking higher and the US30 is no different, with the Industrial Index trading within the $44000 area and potentially looking for more upside. In this article we will look into the technical outlook and project and potential targets higher and analyzing the price action structure. The US30 otherwise known as DJIA which is the Dow Jones Industrial Average Index is a stock market index of 30 prominent companies listed on stock exchanges in the United States.
It is one of the oldest and most commonly followed equity indexes. The US30 includes only 30 large companies. It is price-weighted, unlike other common indexes such as the Nasdaq Composite or S&P 500, which use market capitalization.
The value of the index can also be calculated as the sum of the stock prices of the companies included in the index, divided by a factor, which is approximately 0.152 as of April 2024. The factor is changed whenever a constituent company undergoes a stock split so that the value of the index is unaffected by the stock split.
US30 Weekly Time Frame Technical Outlook

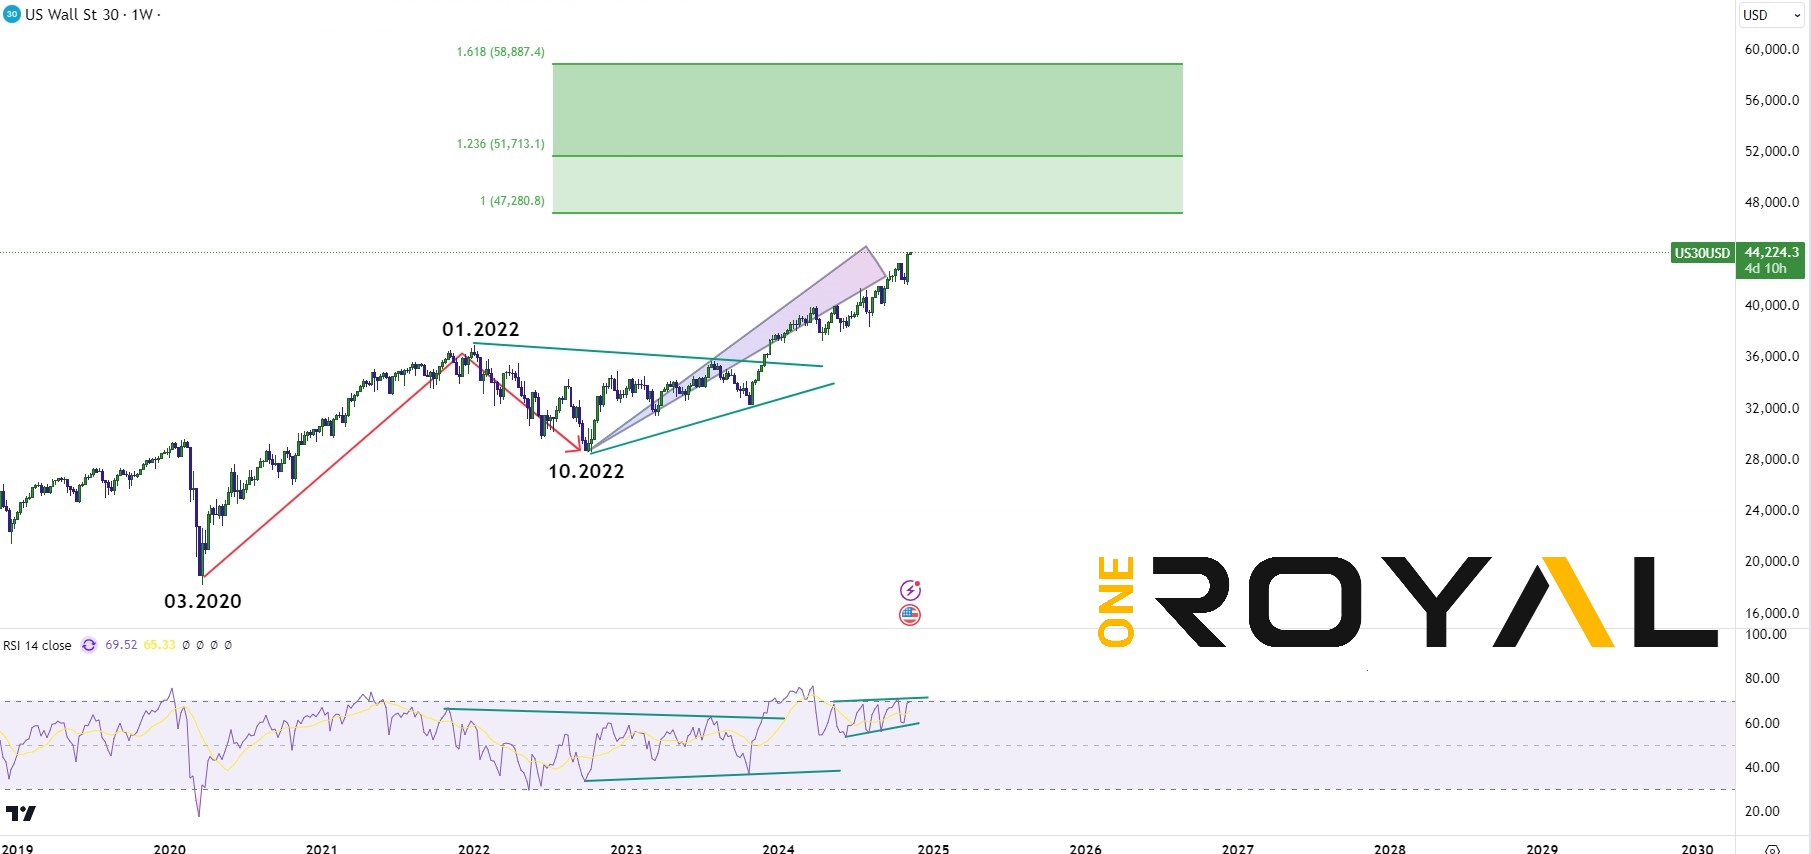
From the weekly time frame we can see that from March 2020 the index completed a cycle higher with a pullback cycle during 2022. The current cycle higher, that started from October 2022 has managed to breakout to all time highs with current price action and RSI suggesting that buyers are still in control for further upside near term. A trend based Fibonacci extension area can be calculated using the cycle from 2020 and it’s 2022 pullback giving us a potential upside target area of $47280.80 – 58887.40 in the weekly timeframe. That represents the 100% – 161.8% trend based Fibonacci extension area.
As far as the RSI continues to stay above 50, especially if it maintains the current channel structure it could continue to extend higher to reach the area. On the fundamental side we continued to see further rate cuts from the US Federal Reserve, as well as the US elections are over and thus removing any political uncertainty to the table for the time being. Worth noting is the replacement of Intel from the Index with Nvidia coming in from November 8th 2024.
But as the Index works differently than SP500, by weighting each company by share price rather than market cap, this means that even though Nvidia recently overtook Apple as the world’s most valuable company, the top spot in the Dow belongs to UnitedHealth, with a share price north of $616 at the time of writing.
Nvidia’s pre-split price of $1,000 would have been too high for the index; at its current price, around $148. However, due to Nvidia’s volatility, it will rank as the eighth-largest influence on the index’s daily movements. Meanwhile, Intel’s exit is no surprise, given its lagging business performance compared to Nvidia. With a share price of around $26, Intel already held the smallest weight in the Dow.
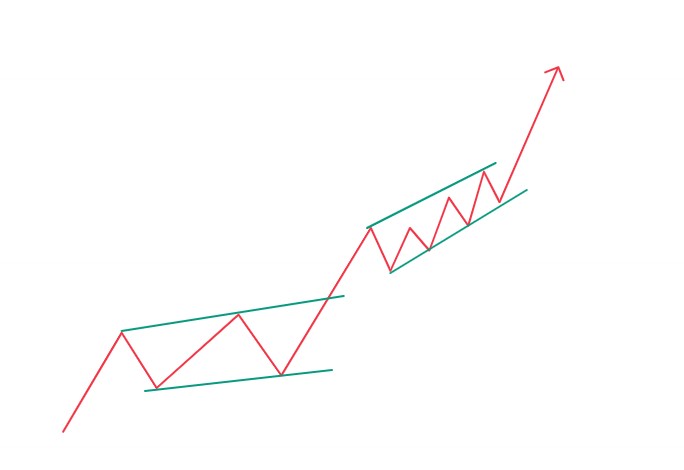
Bullish Running Flat Price Action Followed By A Bullish Accumulation Leads To The Breakout

As seen from the chart the market has made a bullish running flat back in 2023 followed by a breakout and then a higher high sequence with upwards bullish accumulation before the latest breakout that we have seen Since August – September 2024. In Conclusion, at this stage the bullish momentum entails with the above mentioned target areas to be considered while the US Economy for this stage remains overall positive with healthy GDP and stable unemployment rates. The market continues to be optimistic post elections as well as optimistic about further interest rate cuts by the US Federal Reserve.
If you are new here and you do not already have a trading account you can sign up at: https://www.oneroyal.com/en/
Risk Disclaimer: The information provided on this page, including market analysis, forecasts, and opinions, is for informational purposes only and does not constitute investment advice or a recommendation to buy or sell any financial instruments. Investing in financial instruments involves significant risk, including the potential loss of the principal amount invested. Leveraged products, such as CFDs and forex, carry a high level of risk and may not be suitable for all investors. Past performance is not indicative of future results. You should conduct your own research and consult with a qualified financial advisor before making any investment decisions. The firm does not guarantee the accuracy or completeness of the information provided and shall not be liable for any losses or damages arising from reliance on this content. By using this page, you acknowledge and accept these risks.


